Usage
The Usage page is your spend and request analytics dashboard. See total spend and request volume, then break it down by model, provider, key, team, or customer over any time window.
Open Usage in the sidebar. It defaults to your organisation’s usage over the last 7 days.
Views
Switch the View to slice spend differently. Organisation administrators can use:
- Organization (default) — spend across your whole organisation.
- Team — spend per team.
- Customer — spend attributed to end-customers.
- Personal — your own key usage.
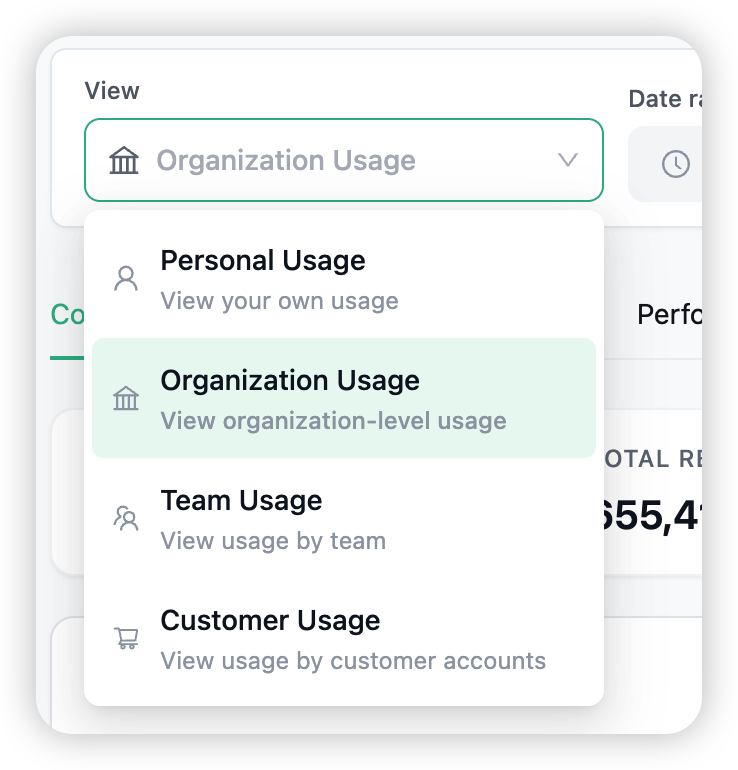
Global, Tag, and Agent views are platform-admin only and are not shown to tenant administrators.
What you see
Each view opens with summary cards — Total Spend, Total Requests, Successful, Failed, and Total Tokens — followed by charts and tables: daily spend over time, spend per entity (team, key, or customer), top API keys, top models, and spend by provider with success rate and throughput. Tabs focus on Cost, Model Activity, Key Activity, Endpoint Activity, and Performance.
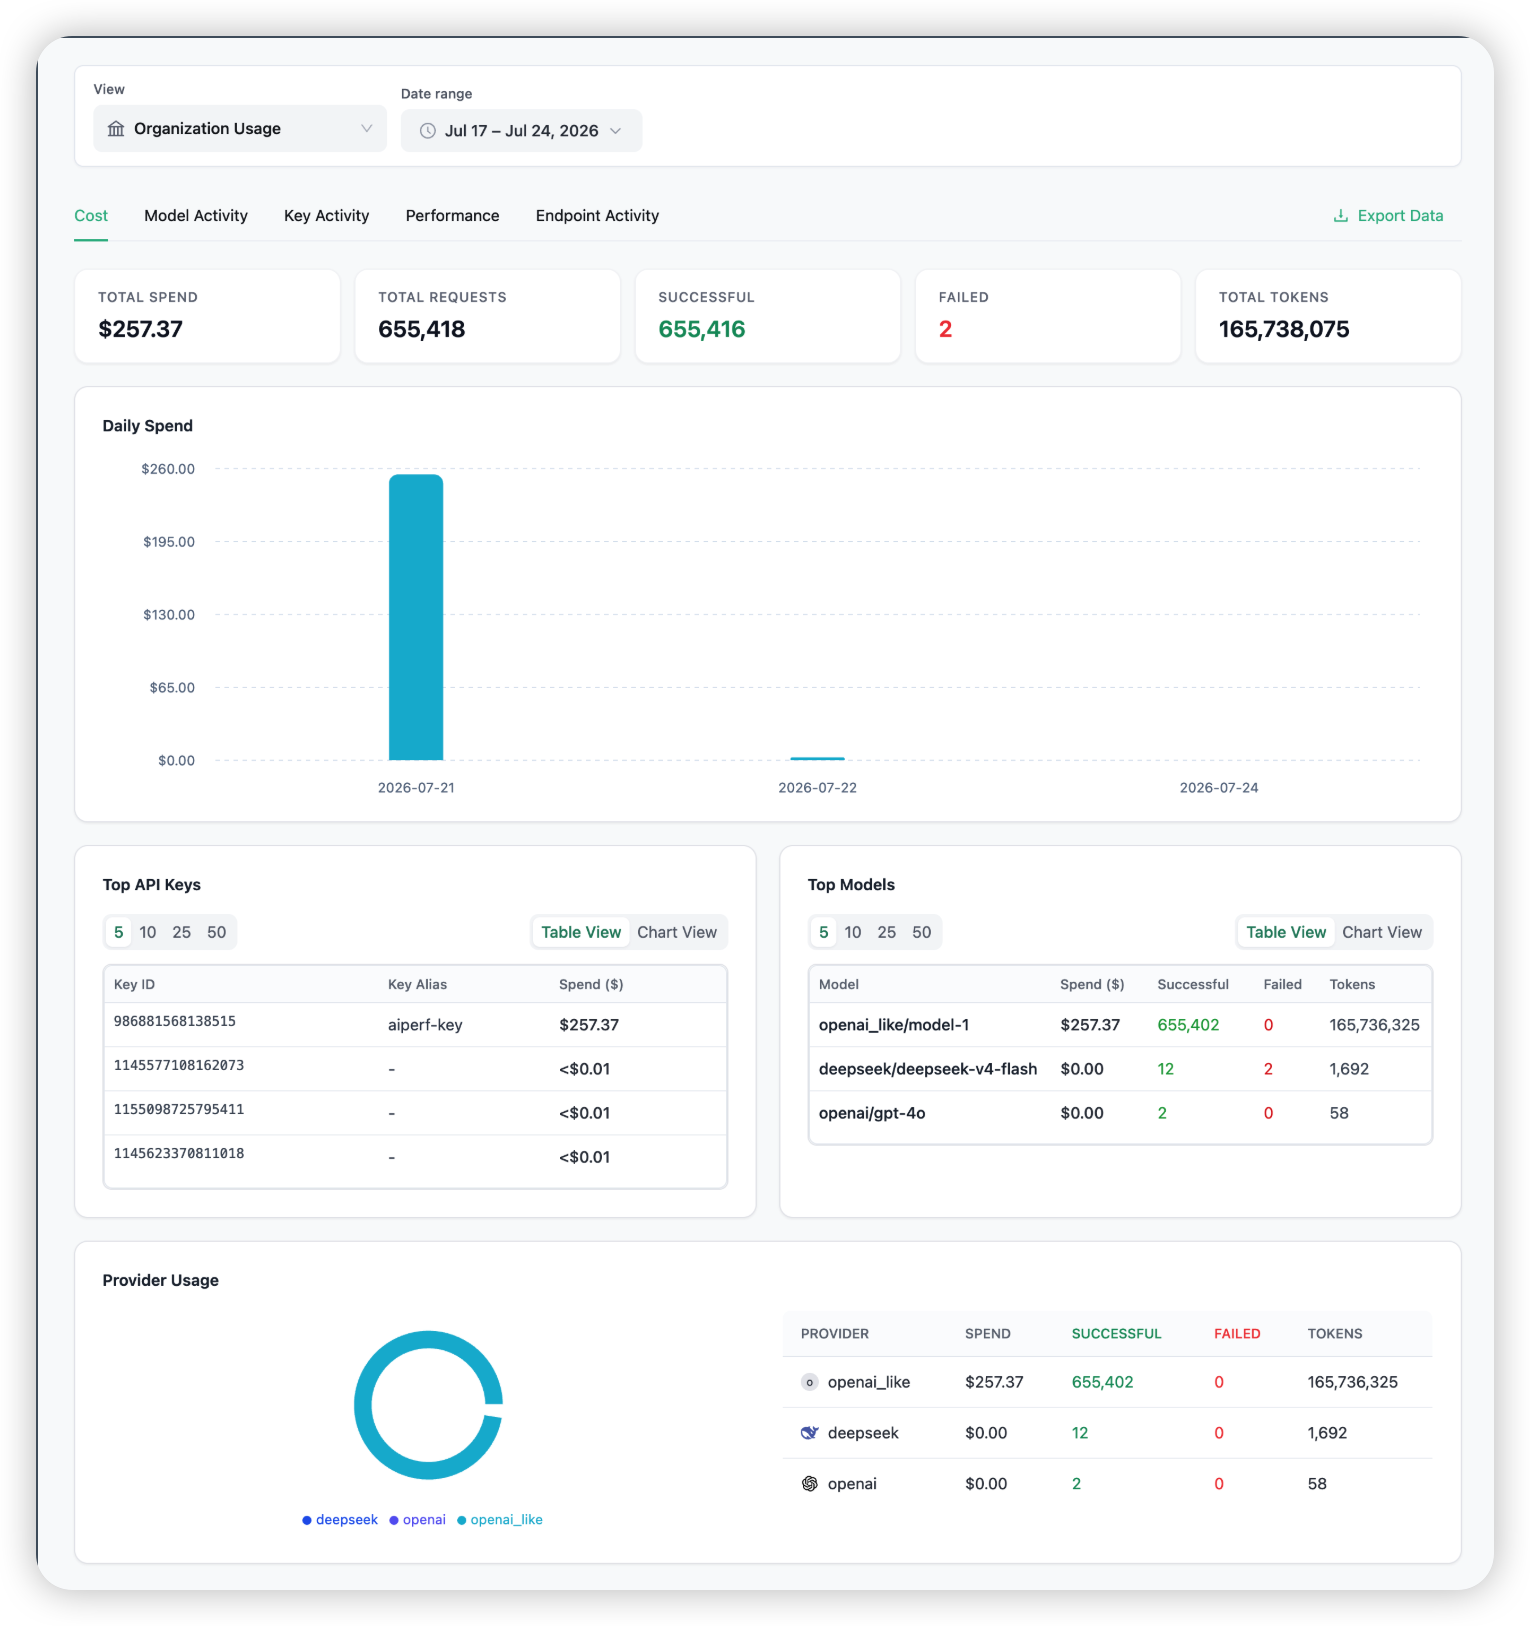
Use Export Data to download the selected view’s spend as a file for chargeback or reporting.
Related
→ Logs for per-request detail. → Budget Limits to cap spend.