Logs
The Logs page is where you inspect everything that happened through the gateway. It is organised in tabs:
- Request Logs — every request, with status, tokens, cost, and latency.
- Audit Logs — who changed which configuration, when, and exactly what changed (organisation administrators).
- Guardrail Violations — every time a guardrail blocked, masked, or errored on a request (organisation administrators). Detailed on the Guardrails page.
- Deleted Keys / Deleted Teams — removed resources, for auditing deletions.
Organisation administrators see every request in the organisation; a regular member sees only their own. The admin-only tabs appear based on your role.
Request logs
The list shows one row per request. Columns cover the time, success/failure status, request and session IDs, model, token count, cost, duration, and the team, internal user, and end user behind the call.
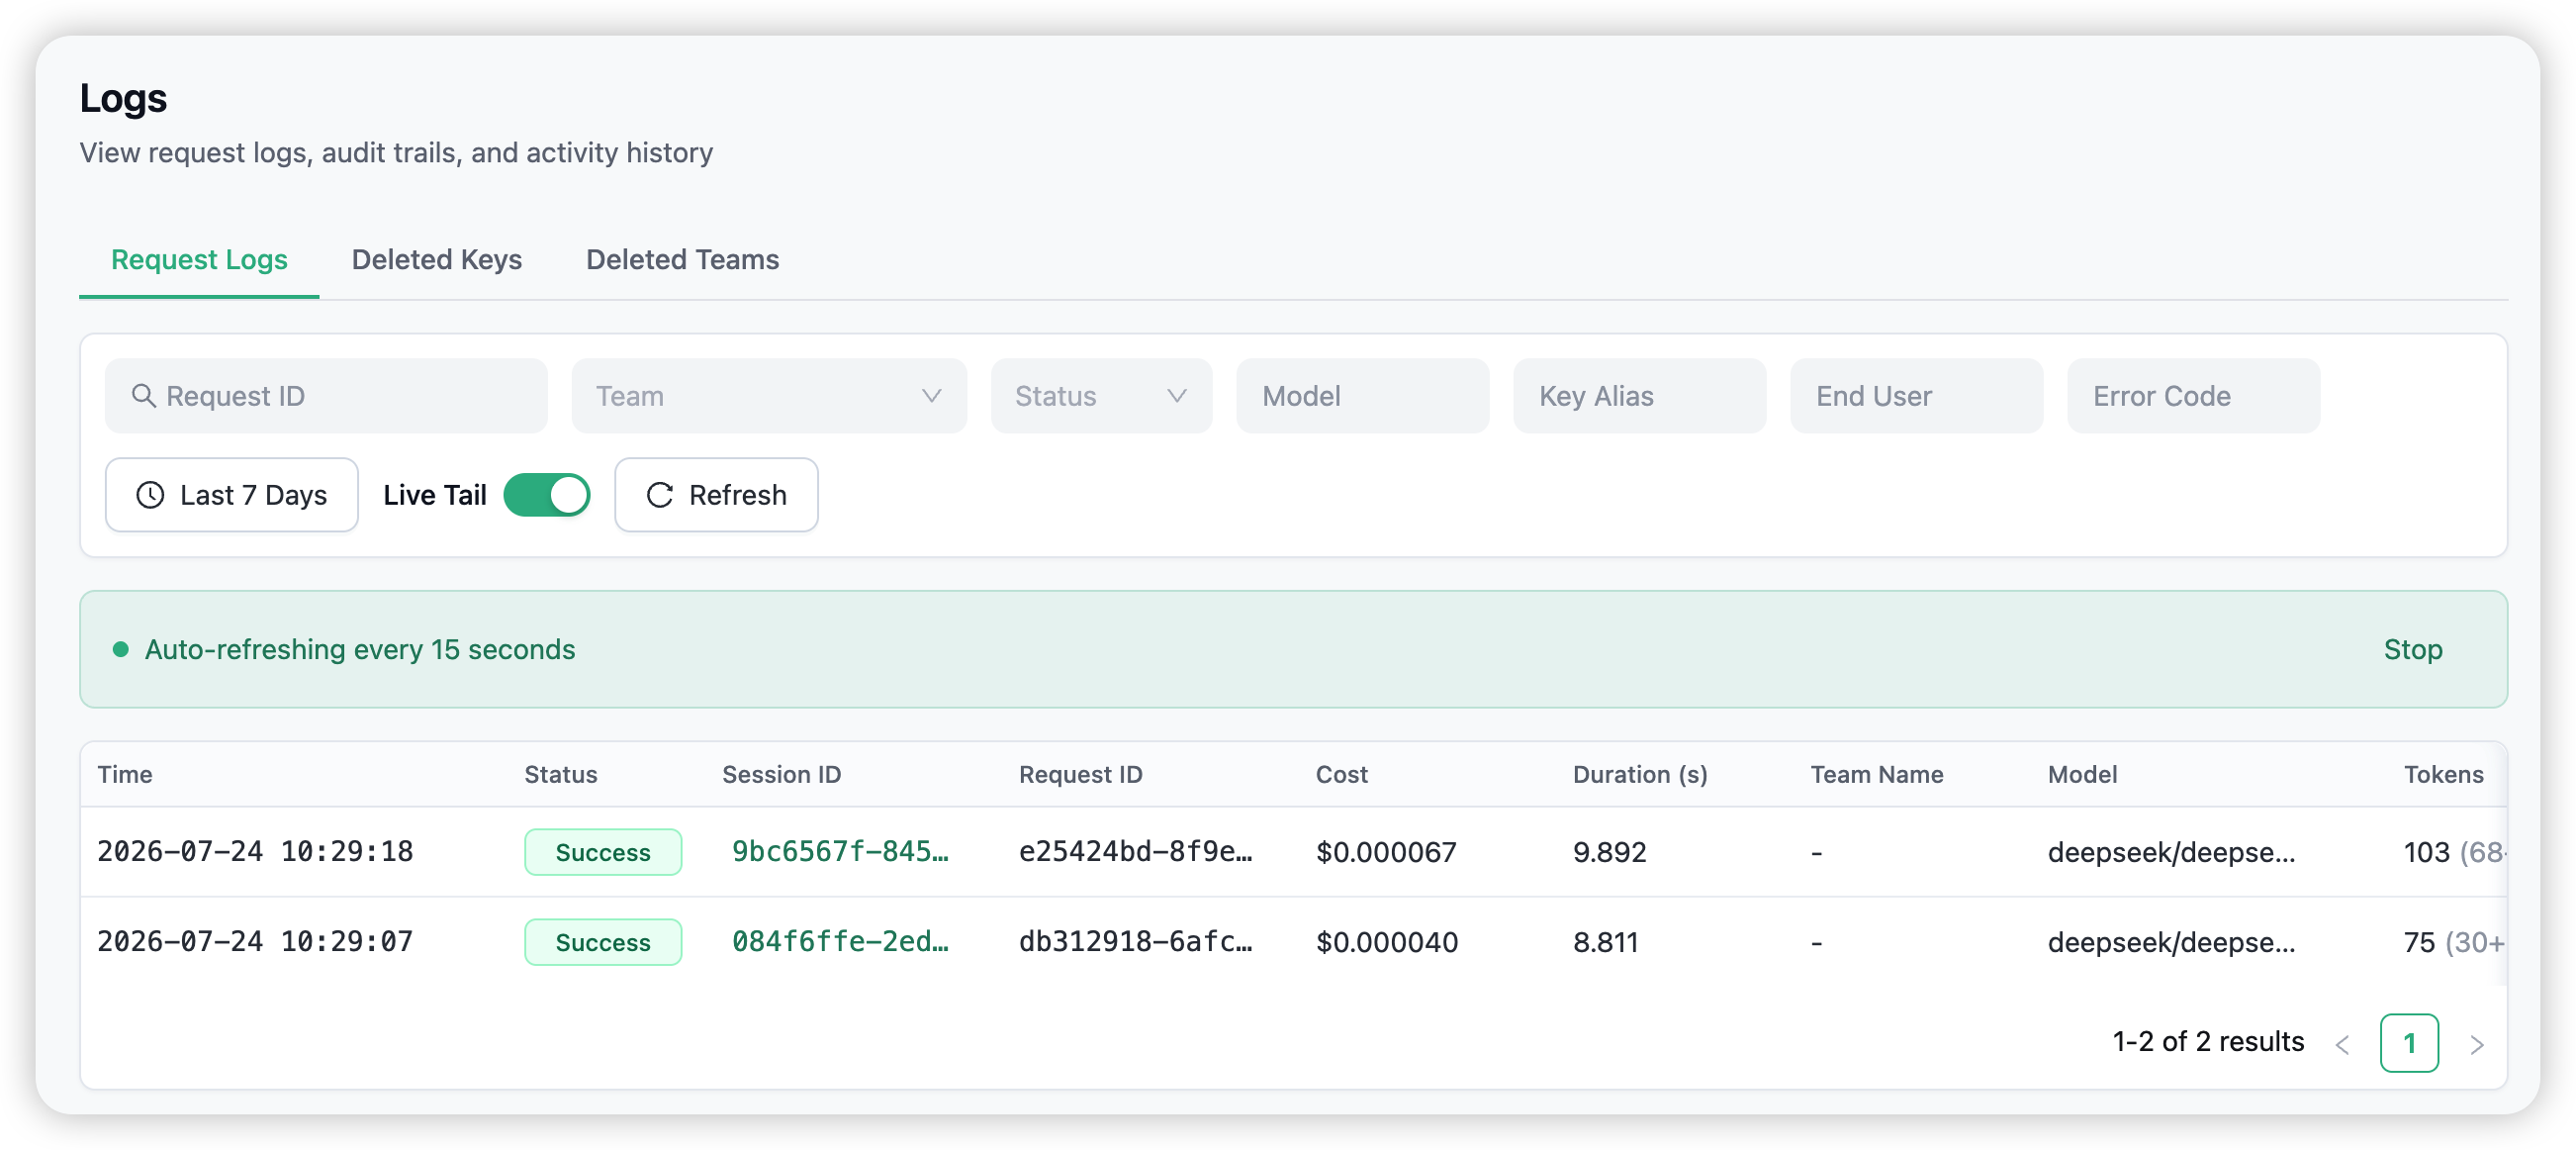
Filter the list by time range (last 15 minutes to last 7 days, or a custom range), team, status (success or failure), model, key alias, end user, error code, or request ID. The list does not refresh on its own — click Refresh to load the newest entries.

Request detail
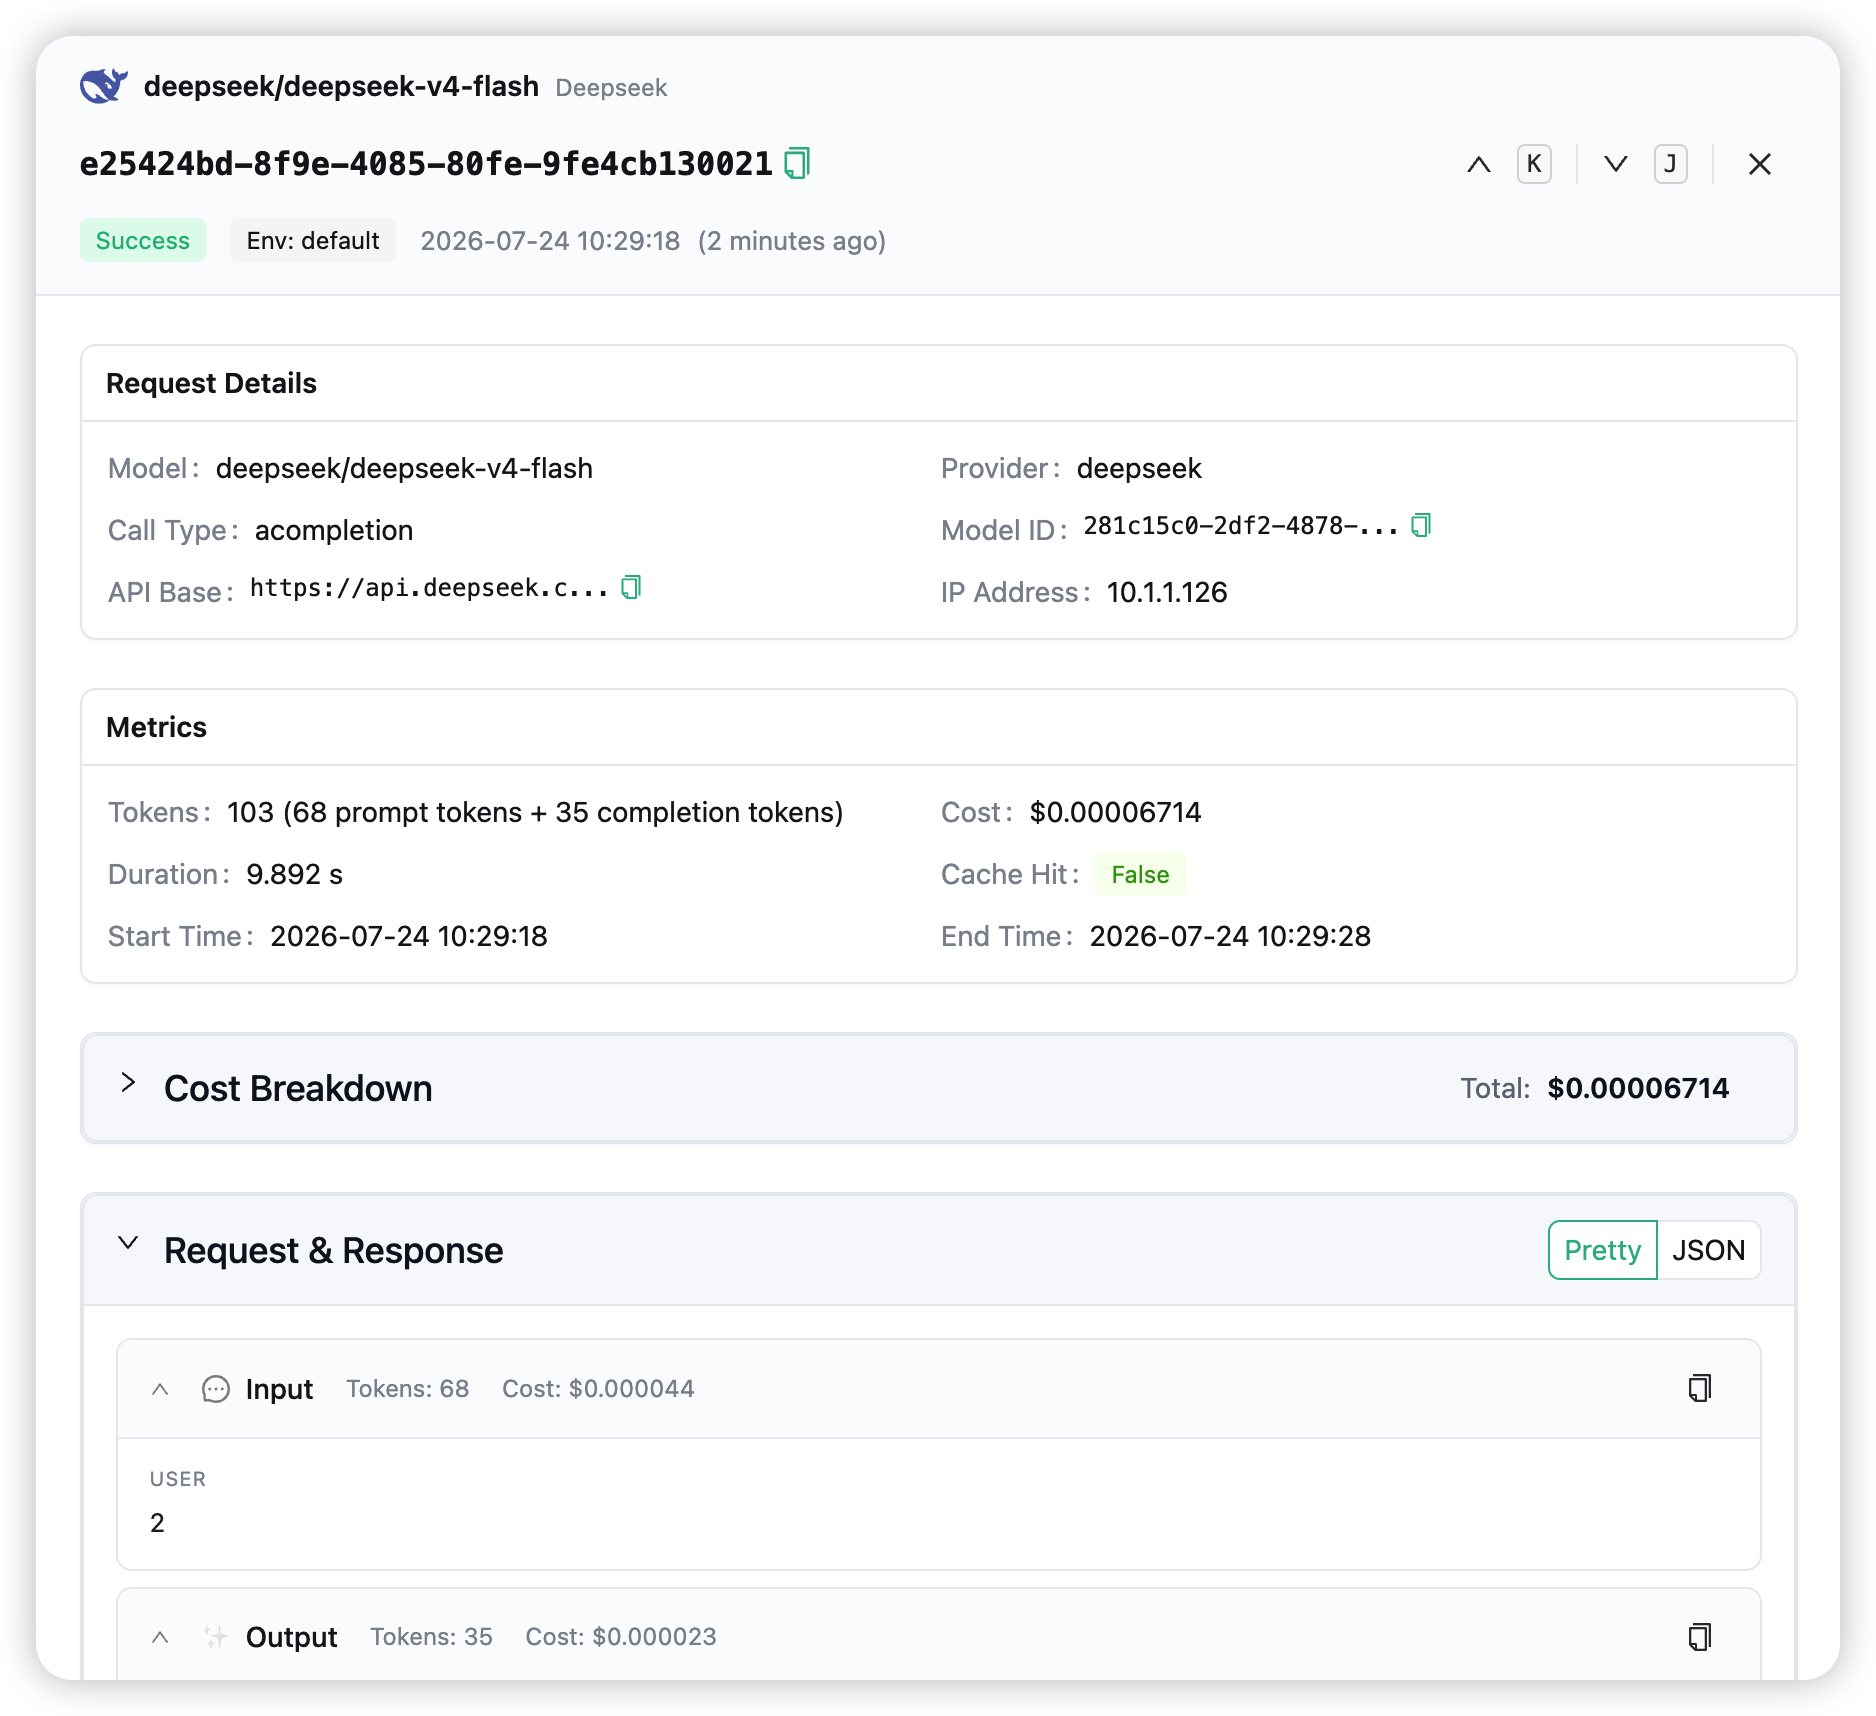
Click a row to open the request detail drawer. It shows the request’s model, provider, call type, and API base; a metrics card with prompt, completion, and total tokens, cost, duration, and cache stats; any tools used; and the full metadata as JSON. When prompt logging is on, a Request & Response panel shows the messages and the model’s reply, with a Pretty/JSON toggle.
Audit logs
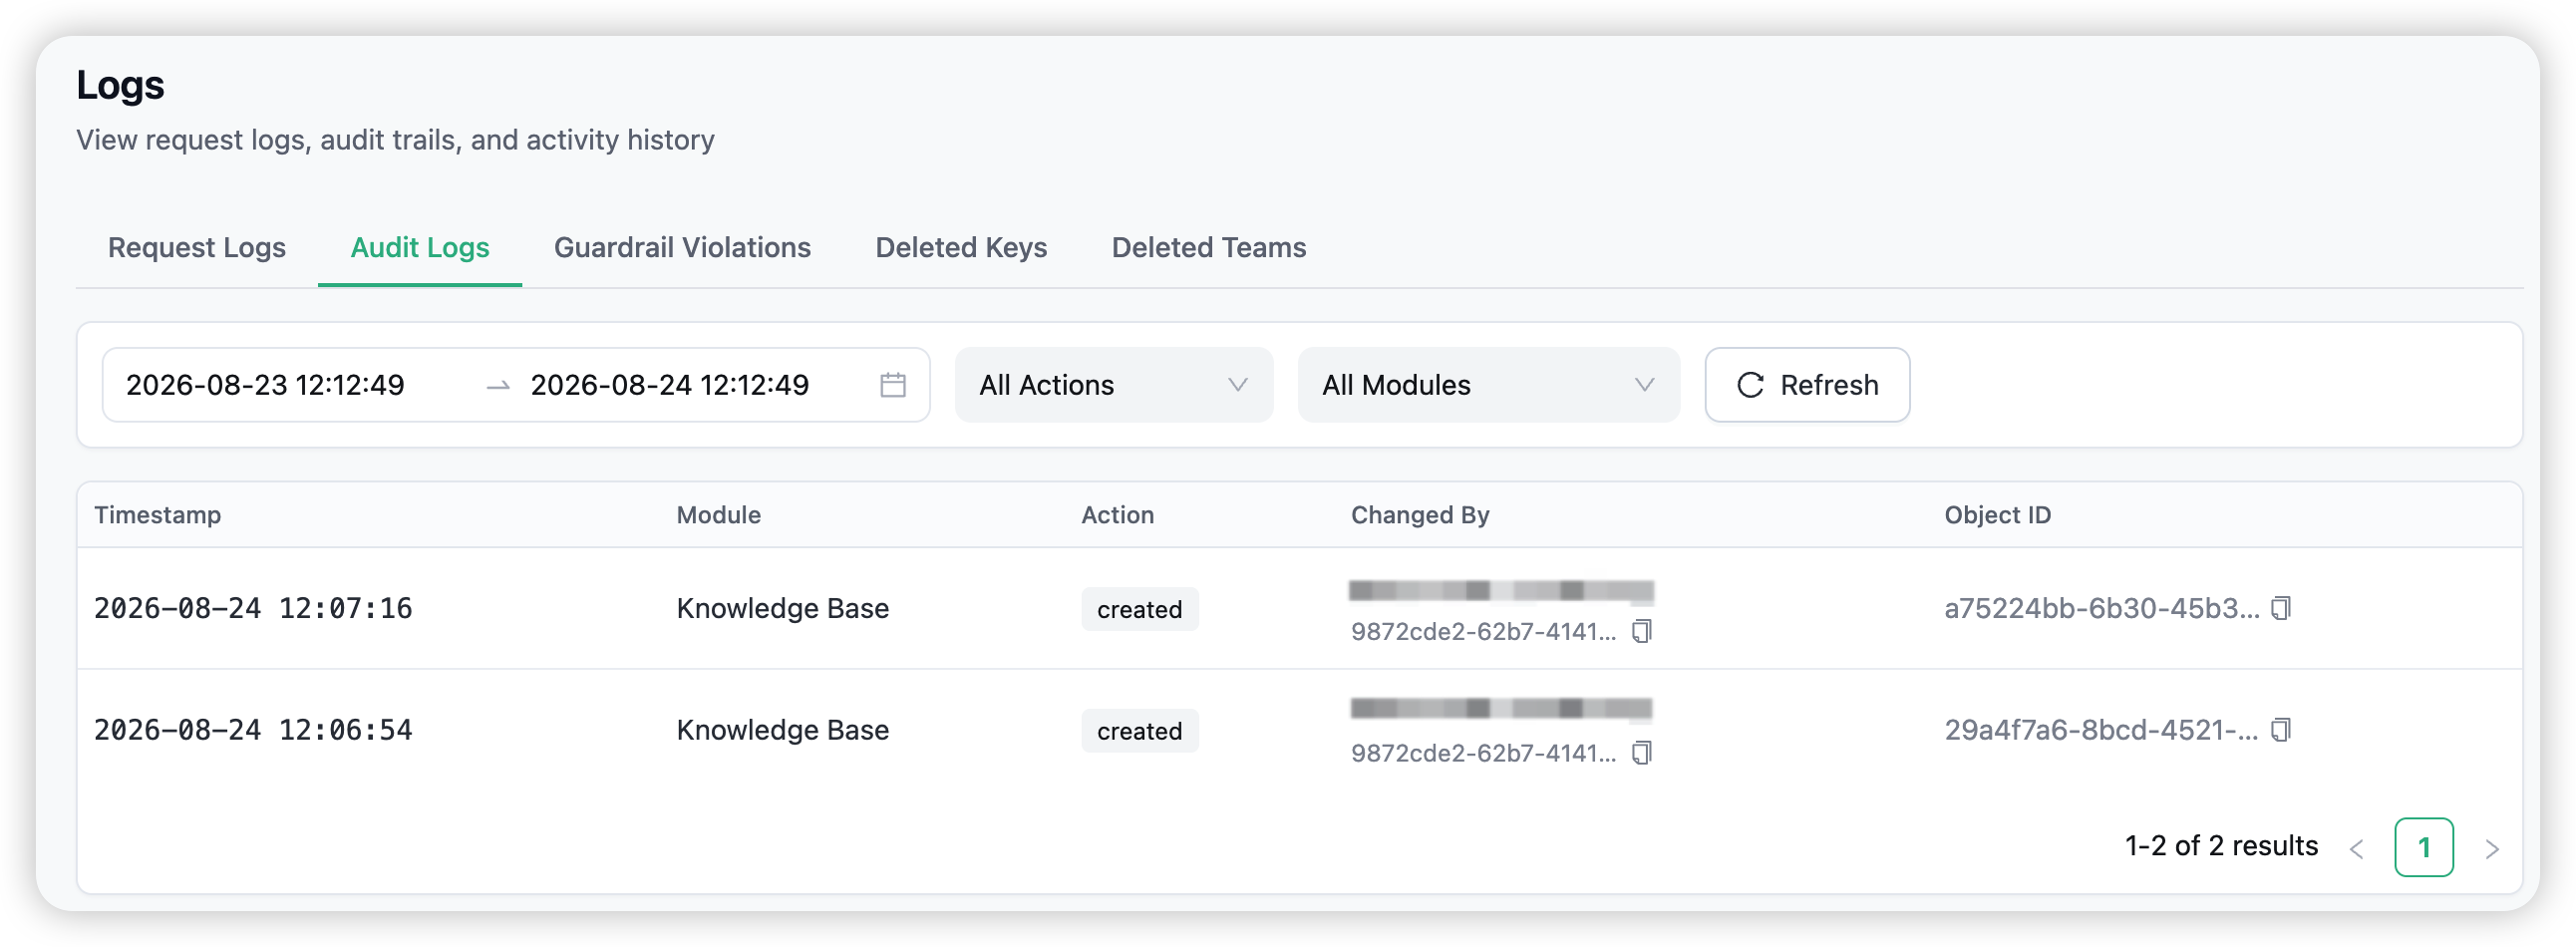
The Audit Logs tab records every configuration change made through the dashboard — who made it, when, and exactly what changed. It answers “who edited this key / deleted this guardrail / changed this model?” rather than tracking request traffic (that is Request Logs).
Each entry shows the timestamp, the module the change touched (keys, models, teams, users, organisations, policies, guardrails, prompts, memory, knowledge bases, token-saving plans, wallets, …), the action (created, updated, deleted, blocked, unblocked, rotated, top-up, refund), who made the change, and the object ID.
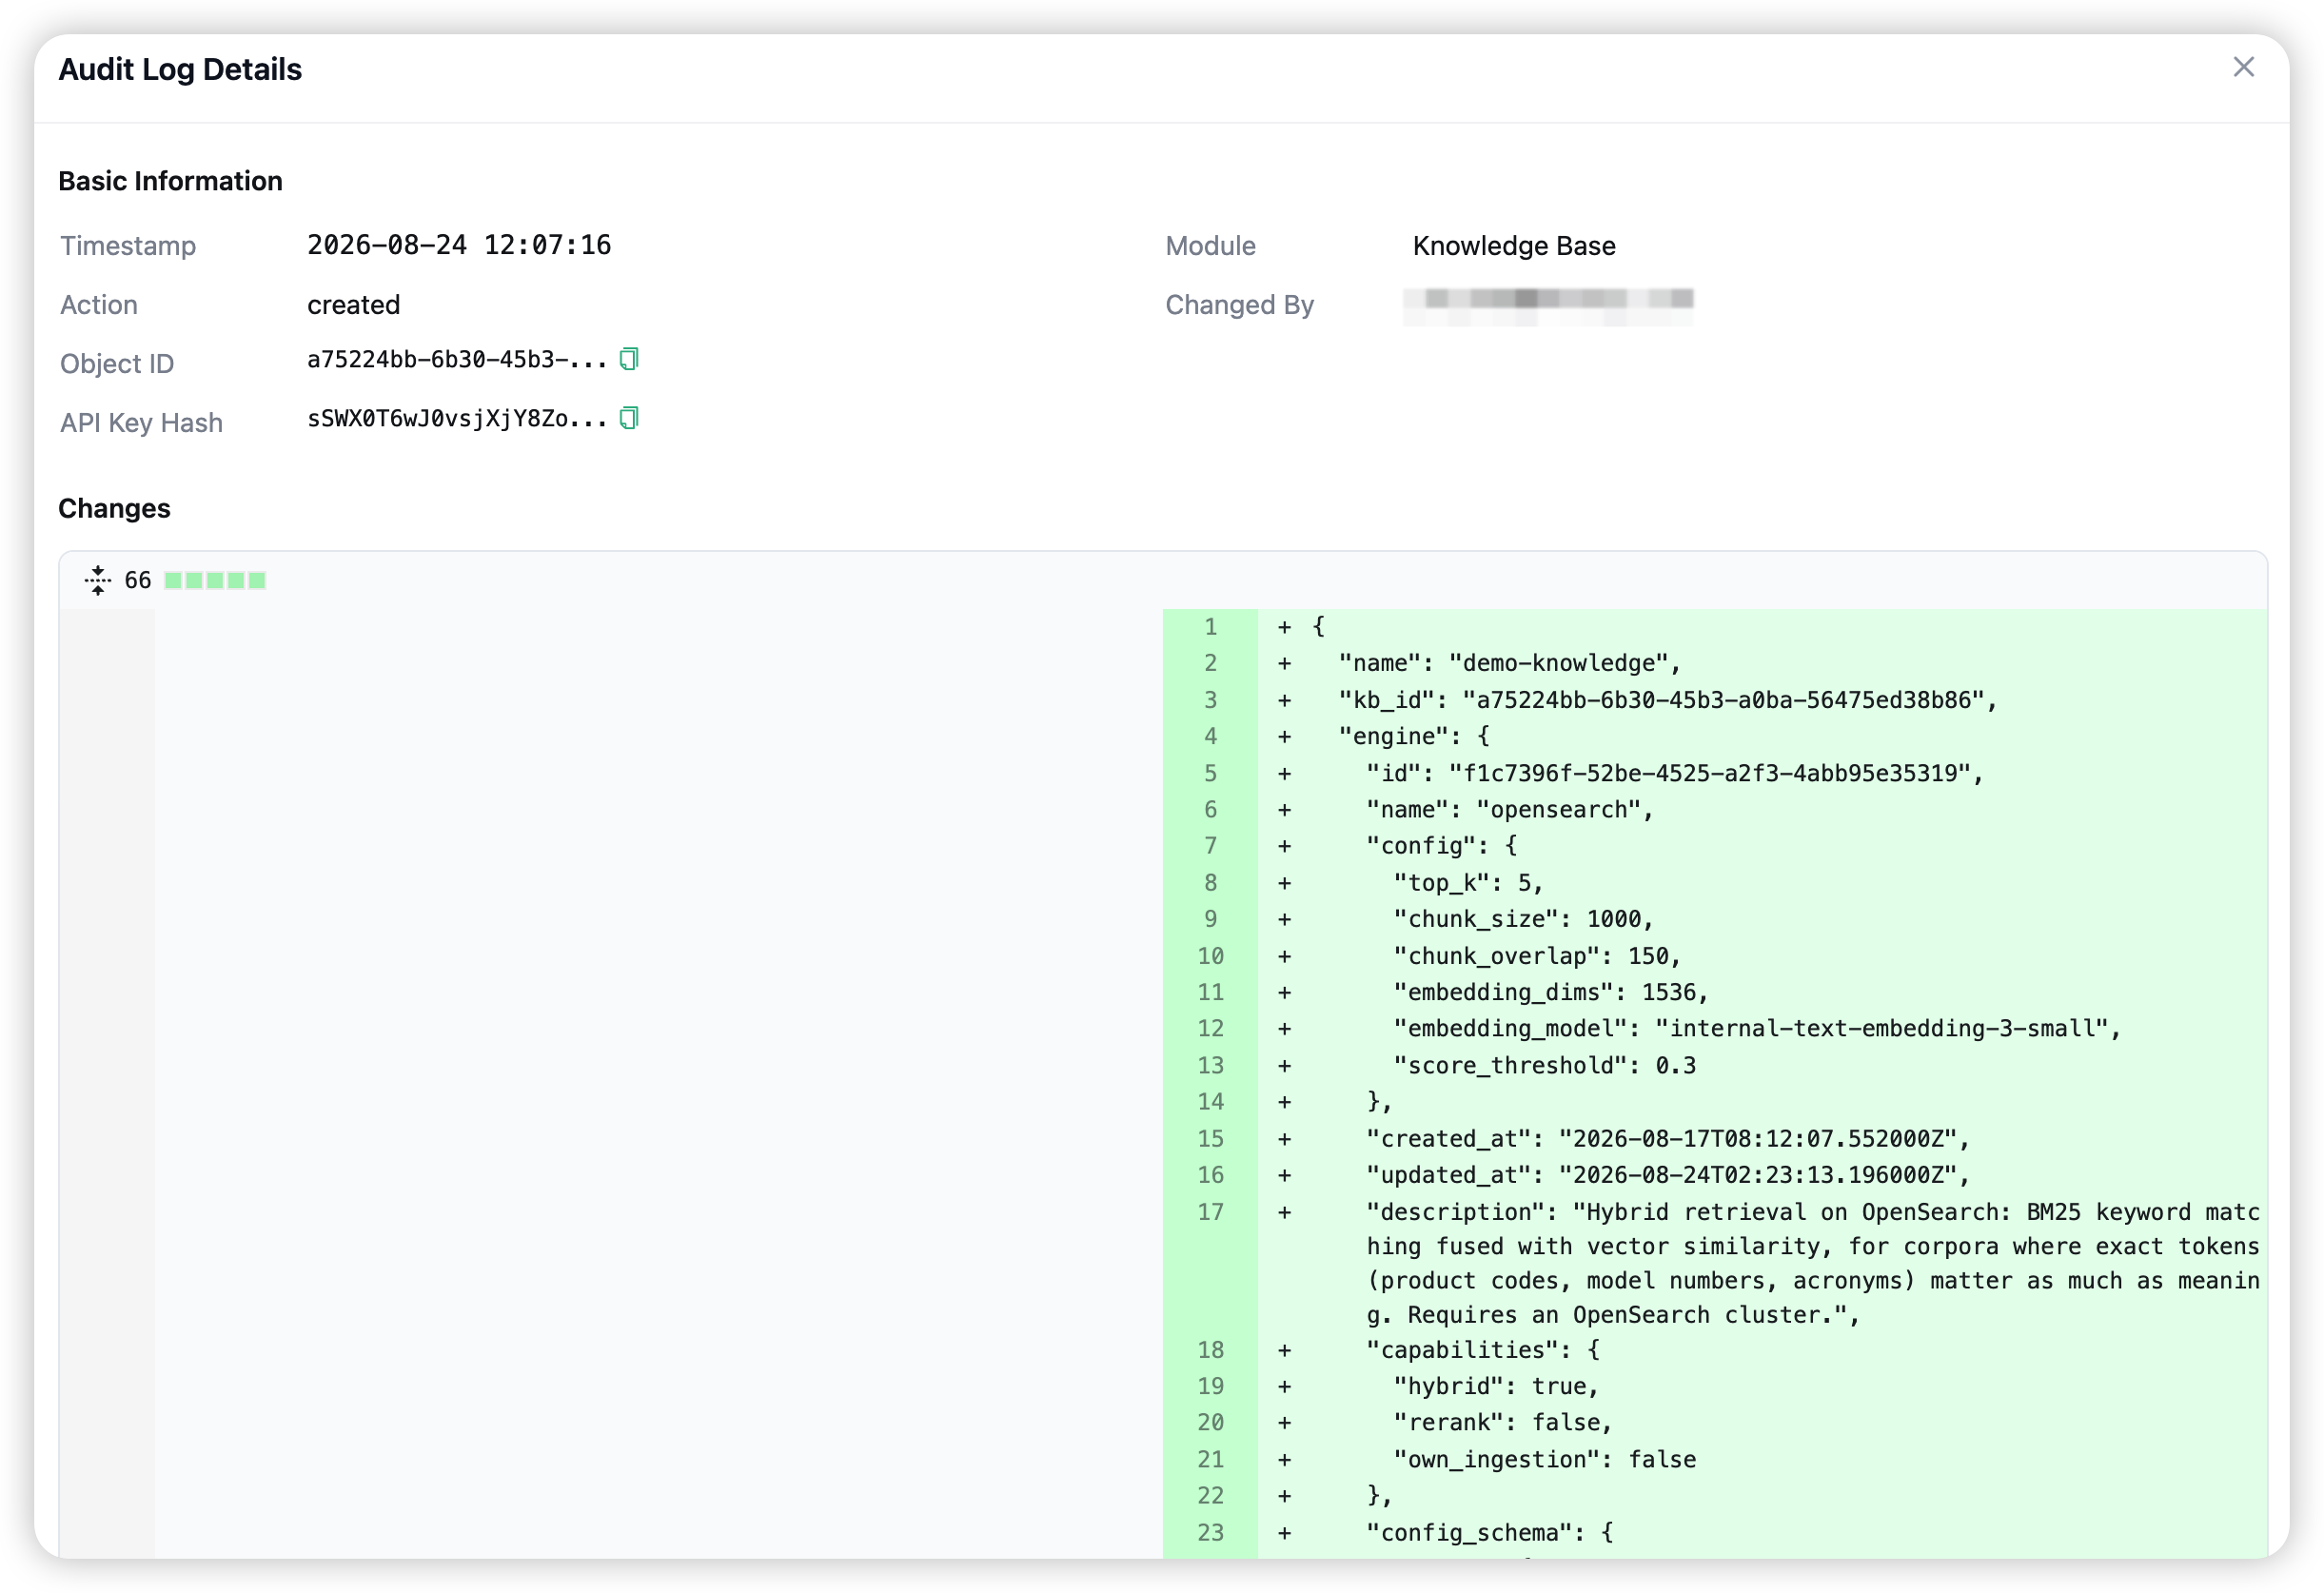
Click a row to open the detail drawer: the basic record plus a word-level diff of the before and after state, so you can see precisely which fields changed.
Filter by time range (default: the last 24 hours), action, and module. The tab is visible to organisation administrators; platform administrators can additionally filter across organisations.
Guardrail violations
The Guardrail Violations tab lists every time a guardrail acted on a request — blocked it, masked content in it, or errored — with summary cards over the selected range and a detail drawer per event.
The tab is administered from the guardrail side: what each outcome means, monitor-mode dry runs, and what is (and is not) stored is documented under Guardrails → Interception records.
What gets logged
Metadata is always logged — model, provider, tokens, cost, timings, status, and the key, team, user, and end-user behind the call.
Prompt and response content is off by default. Storing it is a platform-level setting (not a per-key toggle in the dashboard); while it is off, the Request & Response panel is empty.
Org-admin-only columns and filters — such as the organisation selector and the router-overhead metric — are hidden for tenant administrators; they belong to the platform admin.
Related
→ Guardrails for the interception records shown in the Guardrail Violations tab. → Usage to analyse spend over time. → Budget Limits to cap the spend you see here.